


Selection Criteria and Method Development
By Ray Lombardi, Marc Perla, Rob Cotta, and Robert R. Kerr Ph.D.
Column Chromatography Method Development Checklist
Developing a successful column chromatography method requires more than simply selecting a cartridge and solvent system. Instead, it involves carefully evaluating your compound’s properties and gradually optimizing key parameters. By following the checklist below, you can improve separation quality, increase recovery, and reduce method development time.
1. Match the Separation Mode to Your Analyte
Before selecting a cartridge, first consider how your analyte interacts with different stationary phases. Understanding these interactions will help you choose the best separation mode from the start.
Evaluate Key Analyte Properties
Assess the dominant interactions of your target compound, including:
- Hydrophobicity
- Polarity
- Ionic character
- Aromatic or π-π interactions
- Molecular size
Once these characteristics are understood, selecting an appropriate chromatography mode becomes much easier.
Choose the Appropriate Separation Mode
Normal Phase (NP)
Normal phase chromatography uses silica or alumina and is generally best for nonpolar compounds.
- Separation is based primarily on polarity and adsorption.
- Silica is commonly used for general separations.
- Alumina is more polar and may provide better retention for highly polar compounds.
Reverse Phase (RP)
Reverse phase chromatography is often preferred for polar or ionizable compounds.
- Uses aqueous-organic mobile phases.
- Common stationary phases include C18, C8, and phenyl.
- Frequently provides better peak shape for acidic and basic compounds.
Ion Exchange (IEX)
Ion exchange chromatography is ideal for strongly charged molecules.
- Available in cation and anion exchange formats.
- Separation is controlled through pH or salt gradients.
Size Exclusion Chromatography (SEC)
Size exclusion chromatography separates compounds according to molecular size.
- Best when components differ significantly in molecular weight.
- Commonly used for proteins, polymers, and desalting applications.
Select the Right Stationary Phase
After choosing the separation mode, select the stationary phase that best fits your application.
Normal Phase Options
- Silica
- Amino
- Diol
- Cyano
These phases provide different levels of polarity and hydrogen-bonding interactions.
Reverse Phase Options
- C18 for general applications
- C8 for faster separations
- Phenyl or Phenyl-Hexyl for enhanced aromatic selectivity
Ion Exchange Options
- Strong Cation Exchange (SCX)
- Strong Anion Exchange (SAX)
Choose a phase with sufficient capacity for your sample load.
Size Exclusion Options
- Silica-based media for size-only separations in aqueous systems
- Polymer-based media for desalting, aggregate removal, and broader pH compatibility
Select the Proper Cartridge Size
As a general guideline, load approximately 1-5% of the cartridge mass to maintain good resolution. Therefore, cartridge size should be selected based on sample mass and expected loading.
2. Evaluate Compound Polarity
Once the chromatography mode has been selected, the next step is understanding analyte polarity.
Determine Compound Polarity
Consider:
- LogP or LogD values
- Functional groups
- Hydrogen-bonding potential
These factors will influence both retention and solvent selection.
Solvent Selection for Normal Phase
In normal phase chromatography, it is usually best to begin with a weak solvent and gradually increase solvent strength.
Starting Solvents
- Hexane
- Heptane
These solvents promote stronger retention and improved separation.
Increase Elution Strength Gradually
Then increase polarity using:
- Ethyl acetate
- Dichloromethane (DCM)
- Acetone
This gradual approach often improves resolution.
Fine-Tuning
If compounds show strong retention or tailing, add a small amount of:
- Methanol (MeOH)
- Isopropanol (IPA)
This can help release strongly adsorbed compounds.
Solvent Selection for Reverse Phase
For reverse phase methods, aqueous-organic gradients are typically used.
Common Solvent Systems
- Water/Acetonitrile (ACN)
- Water/Methanol (MeOH)
Buffers may also be added when pH control is needed.
Understanding Solvent Effects
- ACN often produces sharper peaks and lower backpressure.
- MeOH can change selectivity, especially for aromatic compounds.
Improve Peak Shape
To sharpen peaks, consider adding:
- 0.1% formic acid
- 0.1% trifluoroacetic acid (TFA)
Troubleshooting Tip
If a compound streaks badly in normal phase, try switching to reverse phase or adding a polar modifier such as 1-5% methanol.
3. Consider pKa and Ionization
In many cases, pKa has a major impact on retention and peak shape.
Control Ionization
Whenever possible, adjust mobile phase pH to favor a single charge state. As a result, you can reduce secondary interactions and improve peak symmetry.
Reverse Phase Guidelines
For acidic compounds:
- Set pH at least two units above the pKa.
For basic compounds:
- Set pH at least two units below the pKa.
This often leads to cleaner peaks and stronger retention.
Buffer Selection
- Ammonium acetate or ammonium formate for MS-compatible methods
- Phosphate buffers for UV-based applications
Normal Phase Guidelines
For basic compounds:
- Add 0.1-1% triethylamine (TEA)
For acidic compounds:
- Add 0.1-1% acetic acid
These additives can significantly reduce peak tailing and improve peak shape.
Avoid pH Near the pKa
When pH is close to the pKa, multiple charge states may exist simultaneously. Consequently, peak splitting, broadening, and inconsistent retention can occur.
4. Verify Sample Solubility
Even a well-designed method can fail if sample solubility is poor.
Choose an Appropriate Loading Solvent
Ideally, the sample should be dissolved at:
- 10-200 mg/mL
In addition, the loading solvent should be similar to or weaker than the starting mobile phase.
Normal Phase Loading Tips
Preferred solvents include:
- DCM
- Ethyl acetate
- Toluene
Whenever possible, avoid using pure DMSO or DMF.
Consider Dry Loading
For very polar, sticky, or salty samples:
- Adsorb the sample onto silica or Celite®
- Load it as a dry plug
This often improves band shape and recovery.
Reverse Phase Loading Tips
Preferred solvents include:
- Water/ACN mixtures
- Water/MeOH mixtures
Furthermore, matching the starting gradient composition can improve peak shape.
Minimize Additives
Whenever possible:
- Keep salt concentrations low
- Limit DMSO to 2-5%
- Filter samples through a 0.2-0.45 µm filter
As a result, you can reduce channeling and pressure issues.
5. Account for Molecular Weight
Molecular size plays an important role in column selection and method design.
Small Molecules
For compounds below approximately 1,000-1,200 Da:
- Standard 60 Å silica is usually suitable.
- Reverse phase cartridges with 100 Å pores are often recommended.
These compounds typically produce sharp, well-defined bands.
Larger Molecules and Biomolecules
For proteins, peptides, and larger compounds:
- Use wider pore materials (100-300 Å).
- Lower flow rates when necessary.
- Consider ion exchange if charge differences are important.
Loading Recommendations
As a starting point:
- Load 1-5% of the cartridge mass.
However, if impurities are closely eluting, lower sample loading may improve resolution.
6. Confirm Mobile Phase Compatibility
Next, verify that your solvent system is compatible with both your detection method and chromatography hardware.
Detector Compatibility
For UV detection:
- Common wavelengths include 210 nm and 254 nm.
- Avoid solvents that strongly absorb at the selected wavelength.
Ease of Solvent Removal
If fractions will be evaporated or analyzed by MS, choose volatile solvent systems such as:
- Hexane/Ethyl Acetate
- ACN/Water
Hardware and pH Limits
Always operate within the cartridge manufacturer’s recommended pH range.
For example:
- Most RP phases perform well between pH 2 and 10.
- Silica-based normal phase cartridges are not intended for strong aqueous buffers.
Safety Considerations
Finally:
- Properly handle halogenated solvents.
- Minimize static buildup.
- Segregate waste streams appropriately.
- Degas RP solvents when using UV detection to reduce baseline noise.
7. Scout and Optimize the Method
Once the basic method is established, systematic optimization can begin.
Start with TLC
TLC can quickly identify promising solvent systems.
Useful TLC Screens
- Hexane/Ethyl Acetate (0-100%)
- DCM/MeOH (0-10%)
- ACN/MeOH/Water for RP screening
Aim for an Rf value of approximately 0.20-0.35.
Select the Cartridge
Normal Phase
Choose:
- 40-75 µm silica for general use
- 20-45 µm silica for higher resolution
Granular silica is economical, while spherical silica often provides better efficiency and reproducibility.
Reverse Phase
Select:
- C18 stationary phases
- Pore sizes greater than 90 Å
- Particle sizes appropriate for your molecular weight range
Design the Gradient
Example NP Gradient
- Hexane/Ethyl Acetate from 0-40%
- Over 20 column volumes
- Optional 0.5% TEA
Example RP Gradient
- 5-40% ACN in water
- 0.1% formic acid or 10 mM ammonium acetate
- Over 15-20 column volumes
Optimize Flow Rate
Start at moderate flow rates and gradually increase while monitoring pressure and peak shape.
Monitor Fractions
Use:
- UV detection (210 nm or 254 nm)
- ELSD when needed
- TLC, LC/MS, or both for fraction confirmation
Fine-Tuning Options
If additional optimization is required:
- Adjust solvent strength in small increments.
- Modify pH or additive concentration.
- Swap ACN and MeOH in RP methods.
- Swap EtOAc and DCM in NP methods.
These small changes can often produce significant improvements in selectivity.
8. Verify Robustness and Document the Method
Finally, confirm that the method performs reliably under normal operating conditions.
Check System Suitability
Before running samples, verify:
- Stable detector baseline
- Consistent backpressure
- Clean blank runs
- Reproducible TLC results
Evaluate Robustness
A reliable method should tolerate:
- ±5-10% solvent strength changes
- ±20-30% loading differences
- Small modifier adjustments
without significant loss of performance.
Establish Acceptance Criteria
Typical goals include:
- ≥95% purity in pooled fractions
- ≥80% recovery
- Minimal peak tailing
- Minimal overlap with neighboring impurities
Document the Final Method
Record all critical parameters, including:
- Stationary phase selection
- Solvent system
- pKa considerations
- Sample loading approach
- Cartridge size
- Gradient program
- Flow rate
- Detection settings
- Fraction collection parameters
- Sample workup procedure
By thoroughly documenting the method, future runs become easier to reproduce, troubleshoot, and scale up.
Quick Reference Matrix:
| Concern | What to assess | Primary decision | Typical actions |
|---|---|---|---|
| Phase matching to analyte | Dominant interactions | NP vs RP vs IEX vs SEC | Choose cartridge chemistry and mode |
| Polarity | Rf, logD, H-bonding | Eluent strength & type | Adjust hexane/EtOAc or RP ACN/MeOH |
| pKa | Ionization vs pH | Modifiers and buffers | Et3N/AcOH (NP); buffer pH (RP) |
| Solubility | Loader vs gradient start | Focusing & band shape | Dry load; match weak loader |
| Particle Shape | Granular vs Spherical | Cost vs Load vs. Resolution | Granular for Cost, Spherical for resolution |
| Molecular weight | Size & diffusion | Cartridge scale & pore | Set load %, select pore size |
| Mobile phase compatibility | Detector/evaporation | Solvent & additive choice | Volatile systems; UV windows |
Sample Loading and Flow Rate Considerations
Determining Sample Load
The maximum sample load in column or flash chromatography depends on the adsorbent bed capacity, column dimensions, and the complexity of the solute mixture.
- Column bed volume and particle size: Larger columns with higher surface area can accommodate greater sample loads without significant loss of resolution. Finer particle adsorbents increase loading capacity but also raise backpressure.
- General Loading Guidance: For silica gel flash chromatography, typical loading is 1–5% of the column’s silica mass for crude mixtures, and up to 10% for relatively pure compounds.
- Pilot runs: A small-scale test injection helps determine whether peak broadening or co-elution occurs at a given load. Use a series of increasing injection loads. When resolution deteriorates (maximum load vol.), the load must be reduced, or the column size increased.
- Sample solubility: The sample must be dissolved in a minimal volume of a solvent compatible with the mobile phase. Overly concentrated or insoluble samples can cause band distortion. Too high a solvent volume lowers analyte concentrations, potentially compromising resolution.
Flow Velocity Considerations
Column dimensions, particle size, and system pressure limits govern flow velocity.
- Linear velocity (cm/min): More significant than volumetric flow rate, as it normalizes for column diameter.
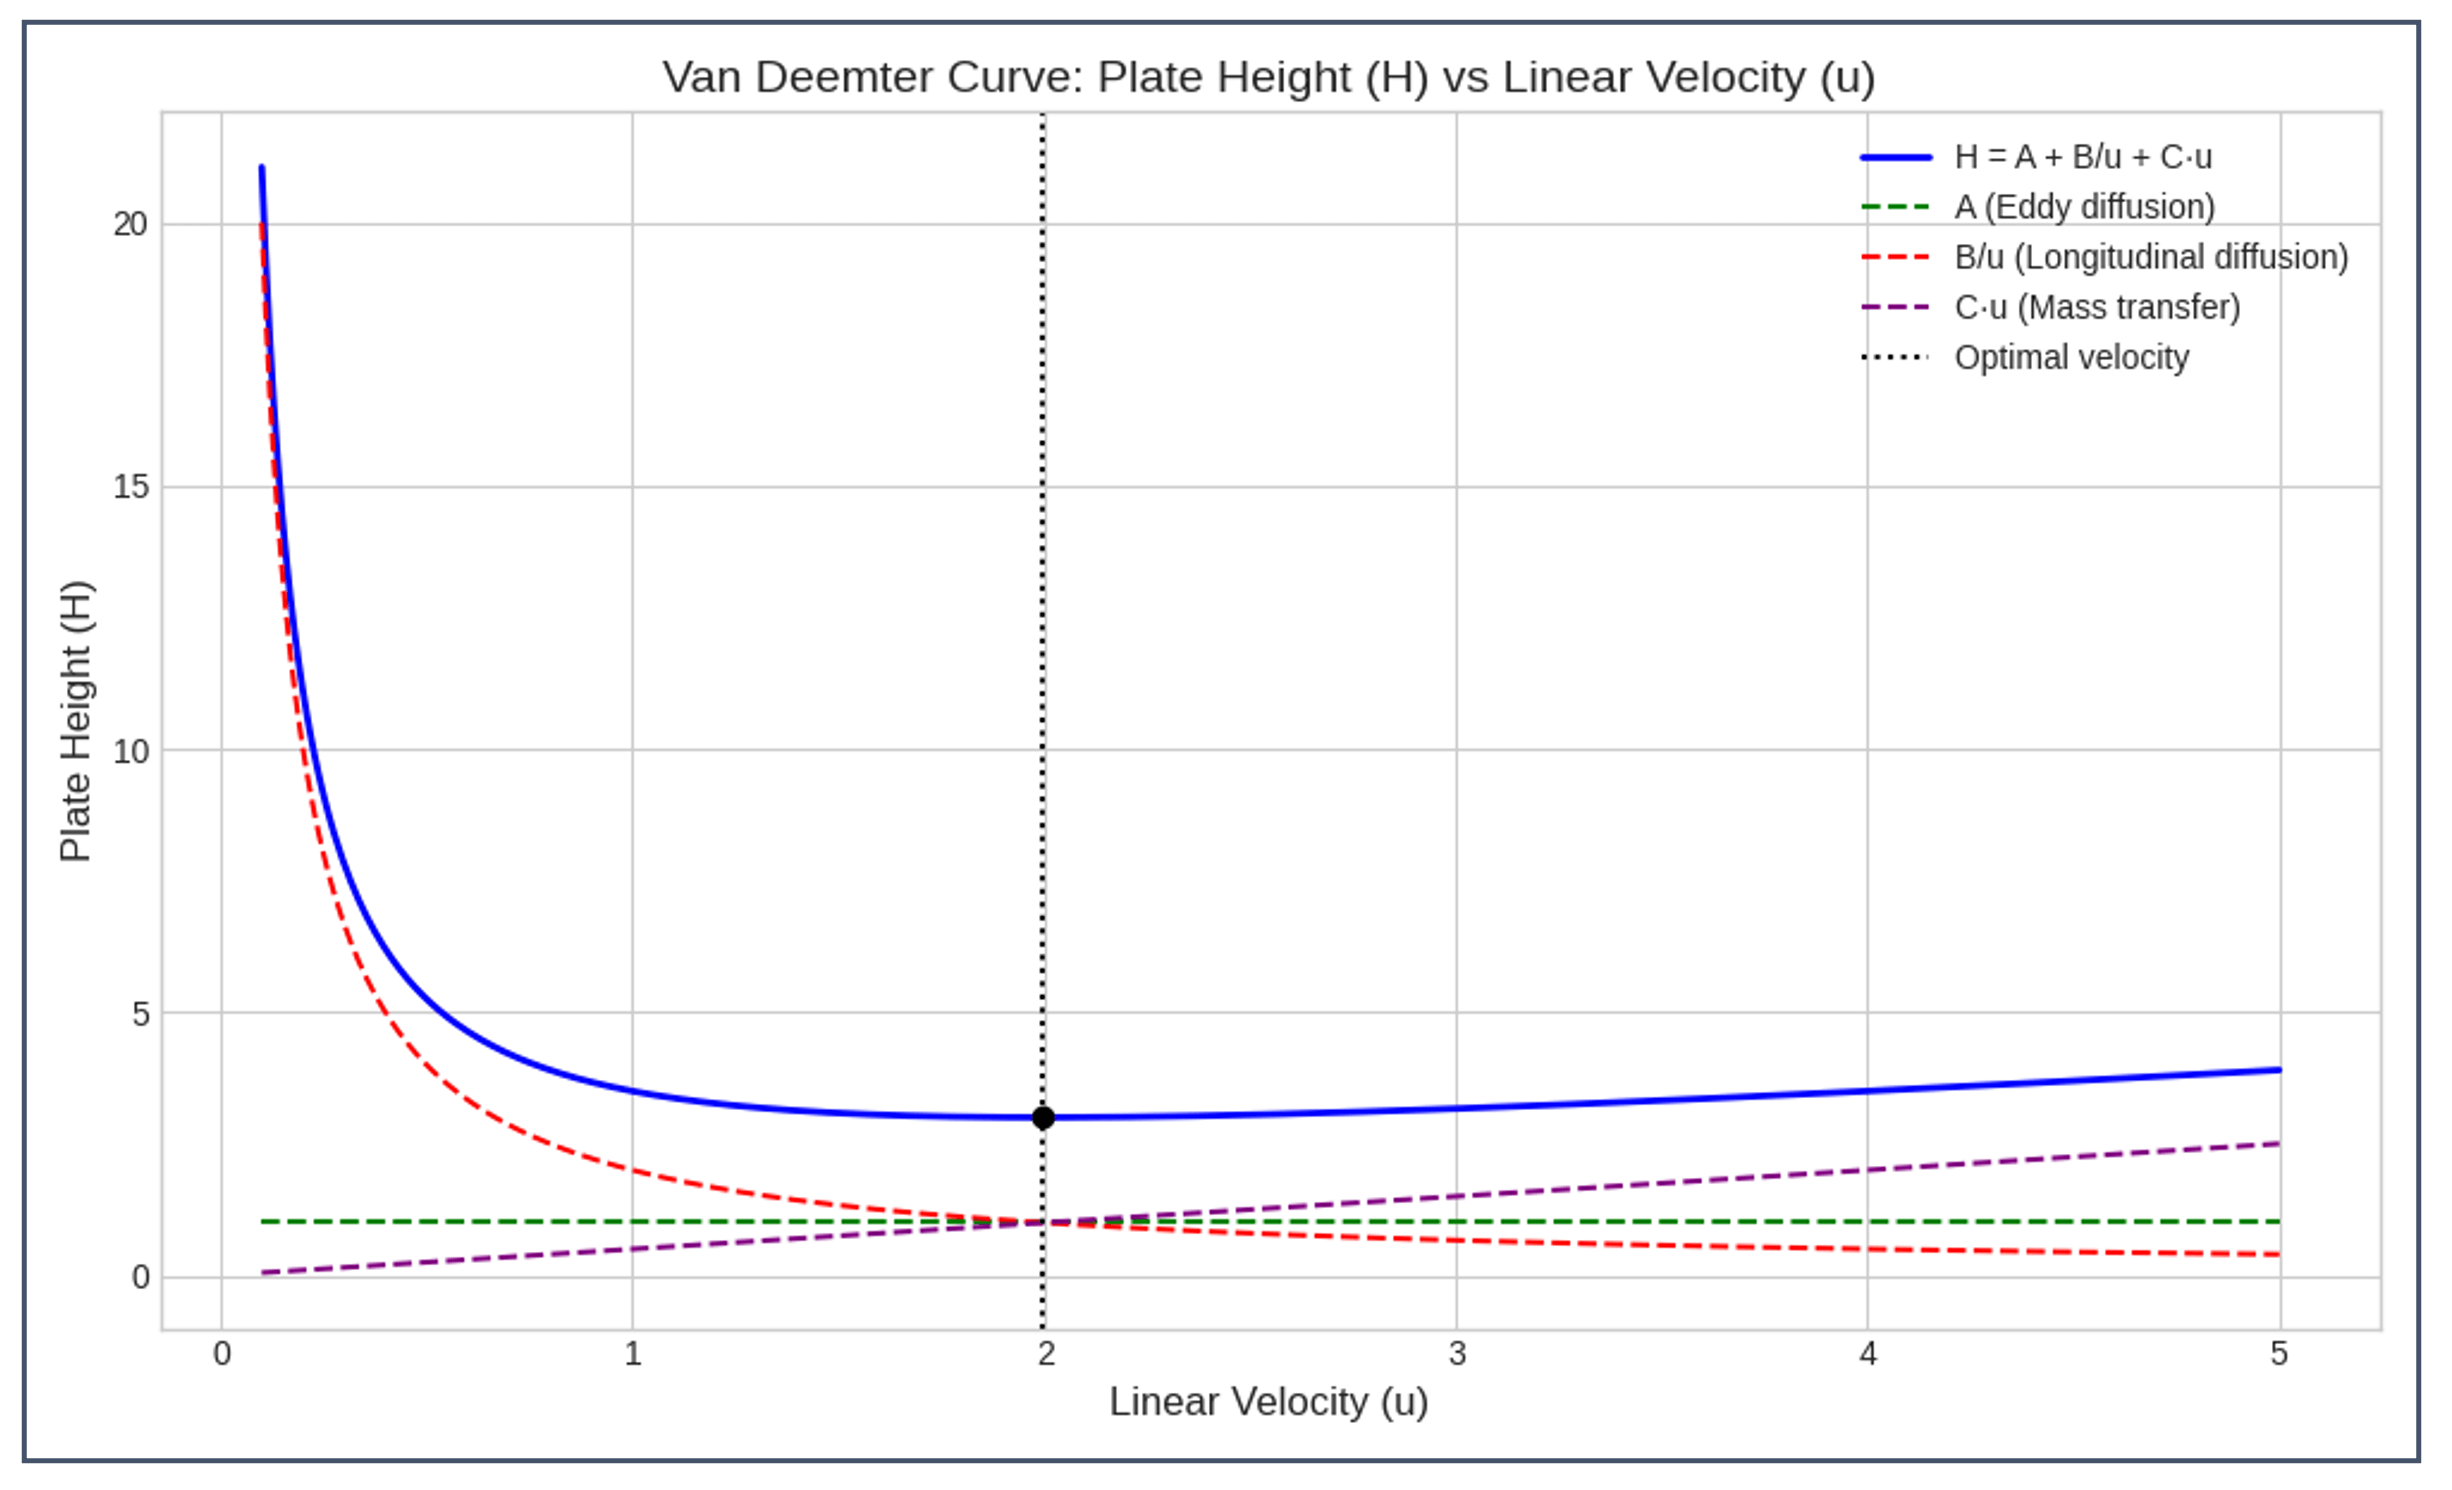
- Van Deemter equation: Resolution is optimized at intermediate velocities. Too slow a flow increases diffusion broadening, while too fast a flow reduces interaction time, resulting in broadened peaks.
- Flash chromatography guidance: Flow rates should be set to produce 2–5 column volumes per hour. Higher flow velocities will shorten run times but will increase the risk of separation inefficiency.
- Pressure limits: Smaller particle sizes (<20 µm) require lower velocities to avoid excessive backpressure, while larger particles tolerate faster flows.
Tuning Resolution vs. Throughput- Resolution vs. Cost
- Resolution priority: Lower sample load, slower flow velocity, and longer column length improve separation. This is critical for complex mixtures or when purity is paramount.
- Throughput priority: Higher flow rates and larger sample loads maximize productivity, but resolution may suffer. This is acceptable for routine separations where minor impurities are tolerable.
- Gradient optimization: Steeper solvent gradients increase throughput but reduce resolution; shallow gradients enhance resolution but extend run time.
Balancing Time vs. Cost
- Time efficiency: Faster runs reduce labor and instrument occupancy but may require larger columns or more solvent to compensate for reduced resolution.
- Cost efficiency: Solvent consumption is a significant cost driver. Slower runs with shallow gradients consume more solvent, while faster runs with steeper gradients use less solvent but may affect purity recovery levels.
- Scaling decisions: For preparative work, cost per gram of purified product often dictates the balance. High-value compounds justify slower, more solvent-intensive runs; bulk/easy separations favor speed and lower solvent use.
Suggested Starting Strategy
- Start with small-scale scouting runs to determine load tolerance and gradient steepness.
- Adjust flow velocity to balance resolution and run time, guided by the Van Deemter curve.
- Scale column dimensions proportionally when increasing load to maintain separation quality.
- Evaluate solvent consumption against product value to decide whether resolution or cost efficiency is the priority.
General Loading Reference for Silica Flash Cartridges
Note: Alumina cartridges typically allow lower load percentages (0.1–4%) than silica cartridges.
| Cartridge Size (Silica Mass) | Column Volume (mL) | Typical Max Load (mg–g) | Practical Range (% of sorbent mass) |
|---|---|---|---|
| 4 g | ~6 mL | 4 mg – 0.4 g | 0.1–10% |
| 12 g | ~20 mL | mg – 1.2 g | 0.1–10% |
| 25 g | ~30 mL | 25 mg – 2.5 g | 0.1–10% |
| 40 g | ~50 mL | 40 mg – 4.0 g | 0.1–10% |
| 80 g | ~110 mL | 80 mg – 8.0 g | 0.1–10% |
| 120 g | ~155 mL | 120 mg – 12 g | 0.1–10% |
| 220 g | ~280 mL | 220 mg – 22 g | 0.1–10% |
| 330 g | ~430 mL | 330 mg – 33 g | 0.1–10% |
| 800 g | ~1050 mL | 0.8 g – 80 g | 0.1–10% |
| 1600 g | ~2000 mL | 1.6 g – 160 g | 0.1–10% |
| 3000 g | ~3910 mL | 3.0 g – 300 g | 0.1–10% |
| 5000 g | ~5800 mL | 5.0 g – 500 g | 0.1–10% |
| Scenario | Sample Load | Flow Rate | Gradient Steepness | Solvent Use |
|---|---|---|---|---|
| Resolution-focused | Low | Slow | Shallow | High |
| Throughput-focused | High | Fast | Steep | Moderate |
| Cost-focused | Moderate | Moderate | Balanced | Low |